Project Overview:
- To help the bike selling company gather insights from data and make meaningful decisions that can drive in more customers and increase profit.
Project files
- Used Sum & Functions to create custom columns and cleaned data using Excel
- Transferred clean data into Pivot Table to gather insights
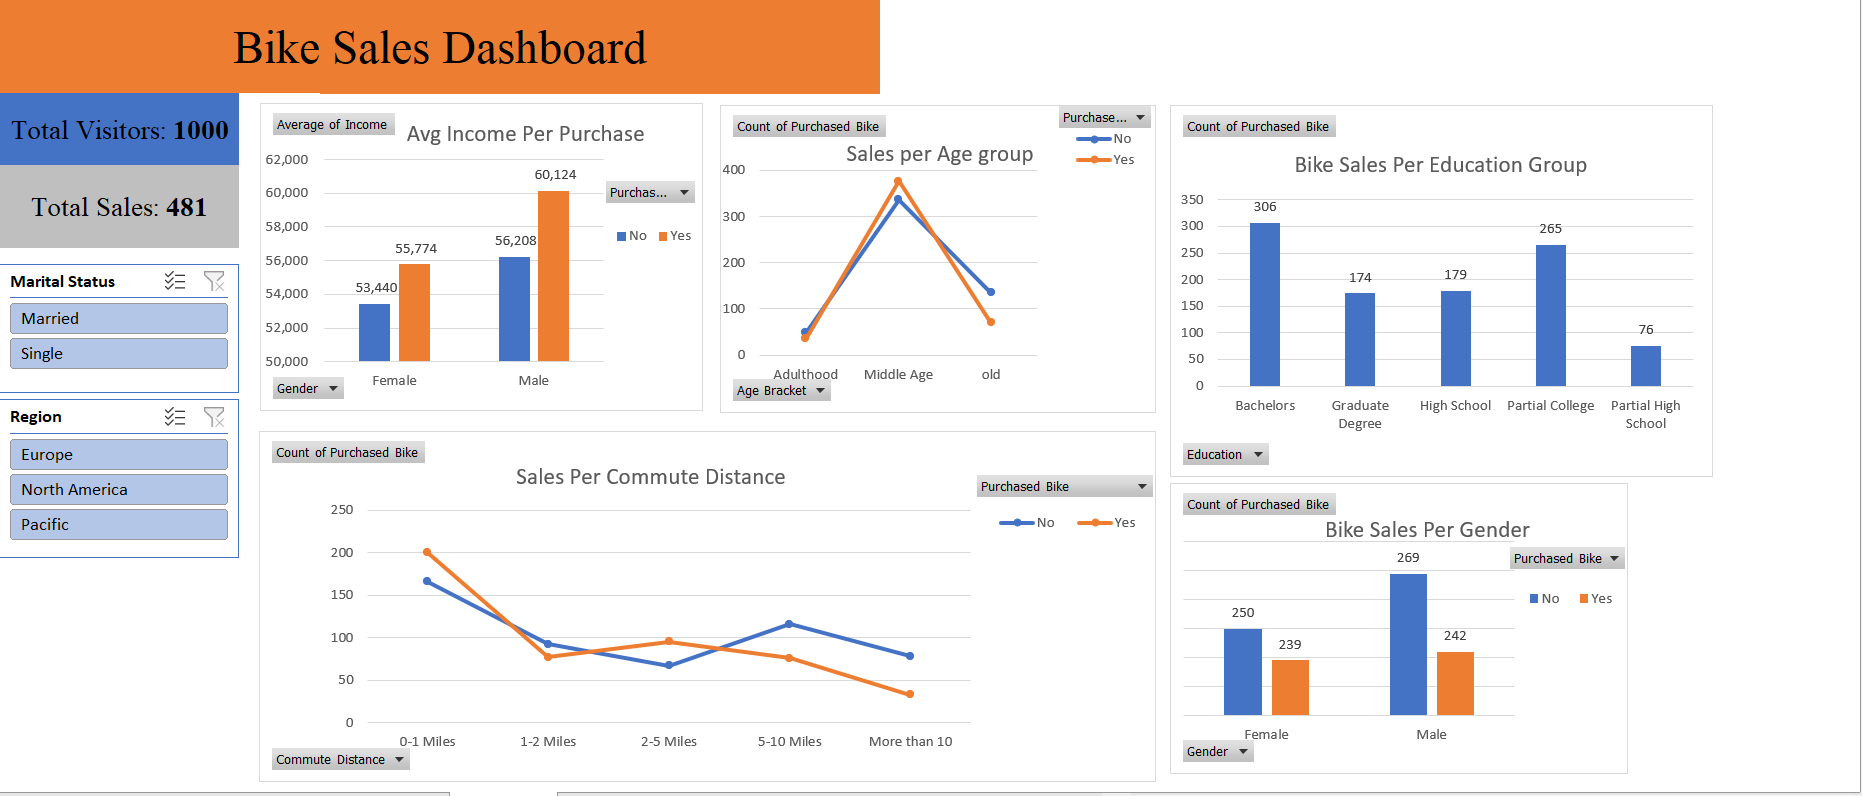
- Used excel’s In-built charts option to preapre an Interactive Dashboard.
Final dashboard picture:

Findings:
- This interactive dashboard prepared in Excel represents customers from different backgrounds and can be filtered by regions and marital status, The dashboard shows customers from different age groups, averge income of customers and educational backgrounds all of which can be very useful to prepare customised marketing and promotional strategy to drive in more profit.
